

Experience the new generation of financial analytics and reporting in Microsoft Dynamics 365 Business Central
How CFOs and finance leaders can make data-driven decisions and optimize business performance.
Why being data driven is key for CFOs
Amid the growing demand on CFOs to catalyze growth, maintaining a holistic view of business performance can be crucial. Data-driven finance leaders not only ensure this is possible within their team, but also empower the entire organization with access to the analysis and insights needed to make informed decisions within the flow of their work, securely.

Dynamics 365 Business Central
The data-driven CFO can use Business Central to optimize business performance.
According to a recent white paper for CFOs (9 Emerging Trends for the Futurist CFO), more than 50% of the identified trends that will affect their departments and businesses over the next few years are about data and reporting.
And if you ask Microsoft Copilot: What are the top three challenges that CFOs in small and medium-sized businesses face in 2024 that can be improved with internal reporting?
You might get an answer such as: In 2024, CFOs in small and medium-sized businesses (SMBs) face several key challenges that can be significantly improved with effective internal reporting. Here are the top three:
- Economic uncertainty: With ongoing fluctuations in the global economy, CFOs need to make informed decisions quickly. Detailed financial reports can provide insights into market trends, helping CFOs to forecast and plan more accurately.
- Cost management: Identifying and controlling costs is crucial for maintaining profitability. Internal reports can highlight areas of inefficiency and suggest where cost-saving measures can be implemented without compromising quality.
- Performance measurement: Tracking the performance of various departments and projects is essential for strategic planning. Internal reports provide valuable data on key performance indicators (KPIs), enabling CFOs to assess progress and make data-driven decisions.
How can you as a CFO or financial leader turn this advice into something more practical, allowing you to help people become more data driven in their day-to-day work? Read on to understand how the business intelligence (BI) triangle model breaks analytics scenarios down into tangible tasks with suggestions of which tools are appropriate for each of them.
The BI triangle: Mapping analytics scenarios to tools
One of the challenges that you face is how to access, analyze, and present data in a way that suits your needs and preferences. Different scenarios and roles in the office of the CFO may require different tools and formats to deliver the best insights and outcomes. That’s why Microsoft Dynamics 365 Business Central offers a comprehensive and flexible set of analytics tools and capabilities that can address the diverse needs and preferences of finance leaders.
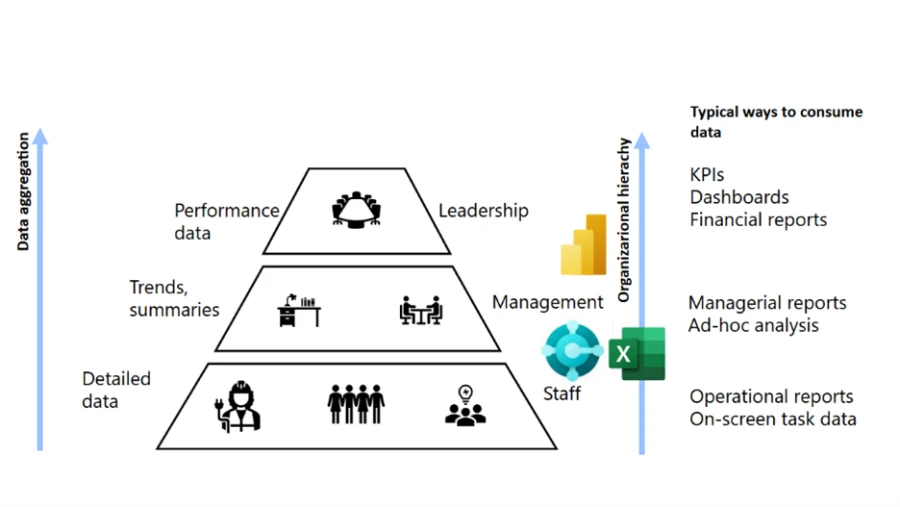
We call this the “BI triangle”, which consists of four types of analytics tools:
- Microsoft Power BI finance reports: Access these reports out-of-the-box including powerful semantic models and stunning and interactive visualizations. You can use the Power BI reports to get an overview of finance KPIs, dive deeper into your data, create custom dashboards and metrics, and share your insights with others. The new Power BI reports are coming in the 2024 release wave 2.
- Financial reporting: This capability set provides no-code financial reporting specialized for producing financial statements that look the way you want.
- Ad-hoc data analysis: Delivers the ability to filter, group, and pivot data directly in Business Central. Use it to get an overview of analytic scenarios not covered by standard reports, drill down into details, and export data to Excel.
- Excel finance reports: Excel reports use Microsoft’s familiar and widely used spreadsheet tool, which is loved by financial professionals for its powerful capabilities in performing calculations, analysis, and formatting. Whether you need to bring your financial data into Excel for easy manipulation, create charts and tables, apply formulas and functions, or analyze outliers with Copilot in Excel, the built-in Excel reports provide the flexibility to present your data exactly as you prefer.
With the BI triangle, you can choose the best tool for the job, depending on your scenario and audience. You can also switch between the tools seamlessly, as they are all integrated with Business Central and use the same data source.
Access more information about the BI triangle here.
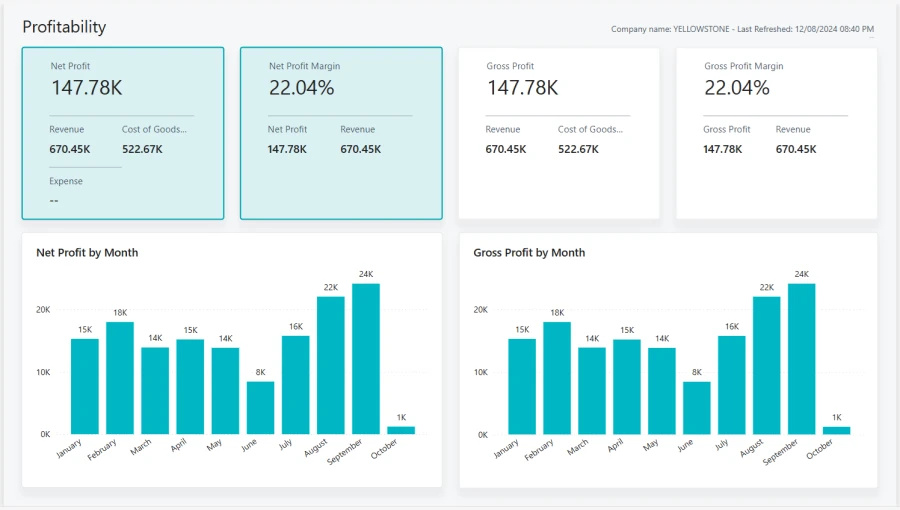
Analyze your business data with new Power BI reports
One of the benefits of using Power BI reports is that you can access a rich set of new and improved reports designed specifically for Business Central and that cover various aspects of your business, such as finance, sales, purchasing, inventory, and projects.
These reports are available out of the box and can be accessed from within Business Central or from Power BI.
Another benefit of using Power BI reports is that you can access your data and insights while on the go from various devices. Whether you’re in the office, on the road, or at home, you can use the Power BI app on your phone or tablet to view and interact with your reports, get notifications and alerts, and stay on top of your business performance.
In the 2024 release wave 2, Dynamics 365 Business Central will include more than 70 reports covering analytics scenarios across finance, sales, purchasing, inventory, and projects.
Track your finance KPIs with Power BI metrics and get alerted in Microsoft Teams when they cross thresholds
With Power BI, you can create and monitor metrics, which are key performance indicators (KPIs) that measure progress toward your goals and objectives. You can easily create metrics on any number shown in your Power BI finance reports and set targets and thresholds for them. You can also view your metrics on your Power BI dashboard and see how they change over time and compare to your targets and thresholds.
You can even integrate your KPIs with Teams and get alerted when your KPI metrics cross certain thresholds, such as when your expenses exceed your budget or when your revenue falls below your forecast. This way, you can stay informed and act quickly and efficiently.
Get executive summaries on your finance data with Copilot in Power BI
Want to use AI to get more from your data? With Copilot in Power BI, you get a conversational AI assistant that can help you get answers and insights from your data using natural language. How about asking Copilot for an executive summary on your financial overview?
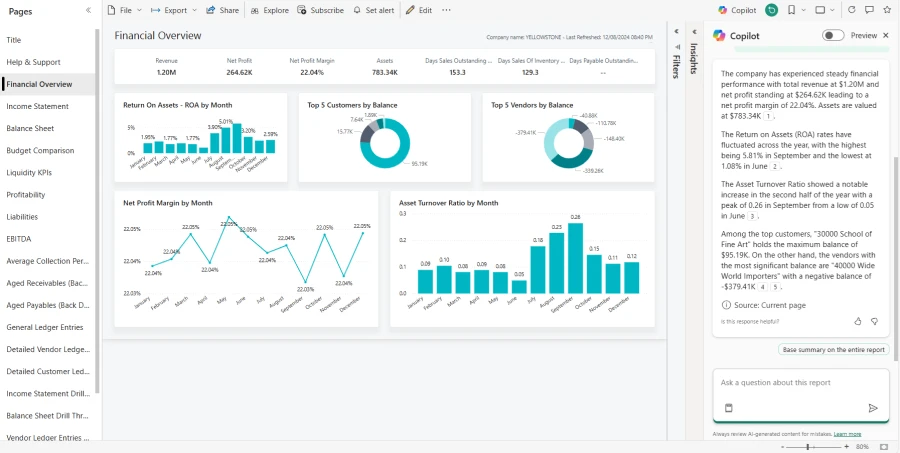
You can use Copilot in Power BI to ask questions about your data, such as: “What is my net income for the last quarter?” or “How does my cash flow compare to the previous year?”. Copilot in Power BI will analyze your data and provide you with relevant and concise answers in the form of charts, tables, or text. You can also use Copilot in Power BI to get executive summaries on your data, by using prompts such as: “Summarize my financial performance for the last month” or “Highlight the main drivers of my revenue growth”. Copilot will generate a summary report that highlights the key facts and insights from your data in a clear and engaging way.
Other ways that Business Central supports the data-driven CFO
Power BI is not the only way that Business Central supports the data-driven CFO. Other analytics features and capabilities can help you access, analyze, and present your data in an effective and efficient way. Here are some examples:
Create financial statements with no-code financial reporting (new templates coming in 2024 release wave 2). This feature allows you to create and customize your own financial statements, such as income statements, balance sheets, and cash flow statements, using a simple and intuitive interface. You can choose from a variety of templates; add or remove accounts, columns, and rows; and format and style your statements. You can also drill down into the details of your data or export your statements to Excel or PDF to share them with others. Access more information about the new Financial Reporting templates in the 2024 release wave 2 here.
Analyze finance data your way with Copilot in Dynamics 365 Business Central analysis assist. This feature allows you to analyze your finance data using natural language and get suggestions and recommendations from an AI assistant. You can explore your data, discover patterns and trends, and find answers and insights.
If you prefer to slice and dice the data, you can open any list in Business Central, switch on analysis mode, and group, filter, and pivot the data your way. When your analysis is ready, you can save it, or maybe share it with a coworker.
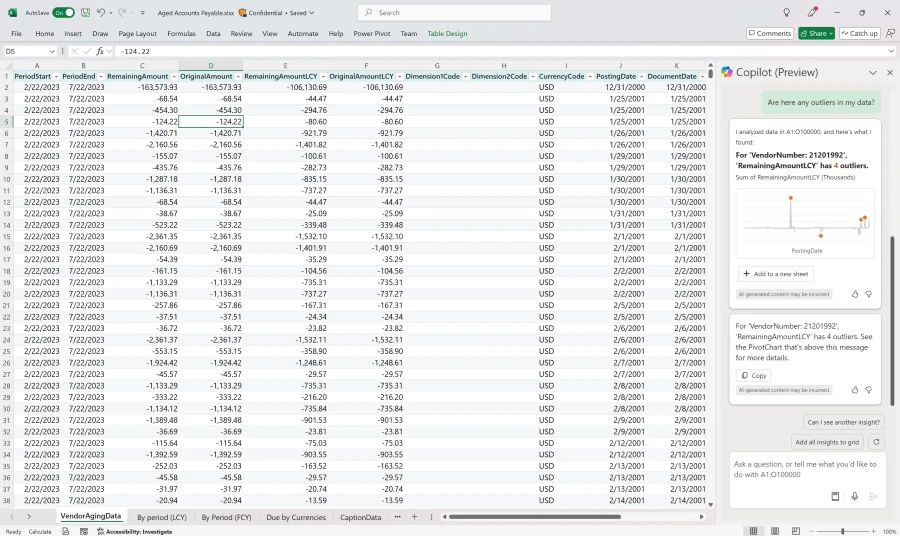
Use out-of-the-box Excel reports for finance (when you want the power and flexibility of Excel). Business Central comes with pre-built and curated Excel reports that cover various aspects of your finance data, such as Trial Balance by Period, Aged Account Receivables, and Aged Account Payables. You can use these reports to view and manipulate your data in your familiar and preferred data tool, create charts and tables, and use formulas and functions, or analyze for outliers with Copilot in Excel.
Harness the full potential of the analytical tools within Business Central
As the roles of the CFO and finance teams continue to evolve, the ability to harness data for strategic decision-making is a necessity. Dynamics 365 Business Central offers a comprehensive and flexible set of analytics tools and capabilities that can empower finance leaders to make data-driven decisions and optimize business performance. Whether you need a quick and easy way to view and explore your data, a powerful and popular tool to analyze and visualize your data, or a familiar and widely used tool to manipulate and present your data, Business Central has you covered. With Business Central, you can also take advantage of the power of AI and cloud to access your data and insights while on the go from various devices, and to get answers and summaries from natural language queries and commands. You can also integrate your data and insights with other Microsoft products, such as Teams, to collaborate and communicate more effectively with your colleagues and partners.
Learn more about using Business Central
If you want to learn more about how the data-driven CFO can use Business Central, visit the financial analytics section of our documentation, where you can find more information and resources on the various analytics scenarios and tools.