Microsoft continues to make significant investments in deep learning, computer vision, and AI. The Microsoft Maps Team has been leveraging that investment to identify map features at scale and produce high-quality building footprint data sets with the overall goal to add to the OpenStreetMap and MissingMaps humanitarian efforts.
As of this post, the following locations are available and Microsoft offers access to this data under the Open Data Commons Open Database License (ODbL).
| Country/Region | Million buildings |
| United States of America | 129.6 |
| Nigeria and Kenya | 50.5 |
| South America | 44.5 |
| Uganda and Tanzania | 17.9 |
| Canada | 11.8 |
| Australia | 11.3 |
As you might expect, the vintage of the footprints depends on the collection date of the underlying imagery. Bing Maps Imagery is a composite of multiple sources with different capture dates (ranging 2012 to 2021). To ensure we are setting the right expectation for that building, each footprint has a capture date tag associated if we could deduce the vintage of imagery used.
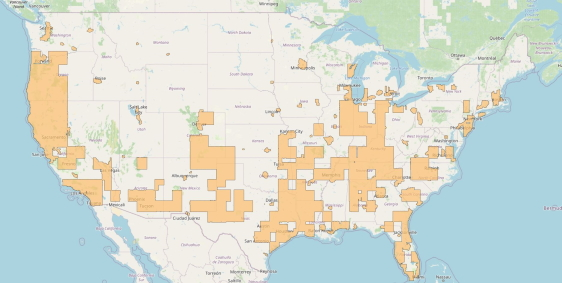
This picture demonstrates how an imagery update can only partly cover a location. In this case, the orange areas covering parts of the United States of America represent a fairly large set of data that would have been collected on clear days without cloud cover or other weather that might obstruct the view to the ground below.

Imagery locations for USA Building Footprint updates
To find out more about Microsoft Maps Open Source projects, like these building footprint data sets, check out our website at Open Source – Bing Maps (microsoft.com)
Learn more about building footprints with Bing Maps API.

