

Today we have released a novel way to visualize and explore the topic hierarchy on the Microsoft Academic website. The Microsoft Academic Graph (opens in new tab) (MAG) uses fields of study, exposed as Topics on the Microsoft Academic website, to categorize entities. These fields of study (opens in new tab) are hierarchical in nature, grouping specific fields of study under larger, more generic fields of study. Over the past year we have thought a lot about how to help our users visualize our topic hierarchy and the connections within it.
Entity Analytics is a big part of the Microsoft Academic website. On our analytics pages, we show statistics of each entity in our graph as well as rankings and trends. However, navigating through the 700K+ topics can be a difficult task. In previous releases we created a Topic browser control that allows you to search for topics you are interested in. Once a desired topic is selected, parent and child topics are displayed to help users understand the hierarchical nature of topics in our graph and navigate between them. This control fits its basic purpose but does not give the user perspective on the scale of topics available and how they are connected.
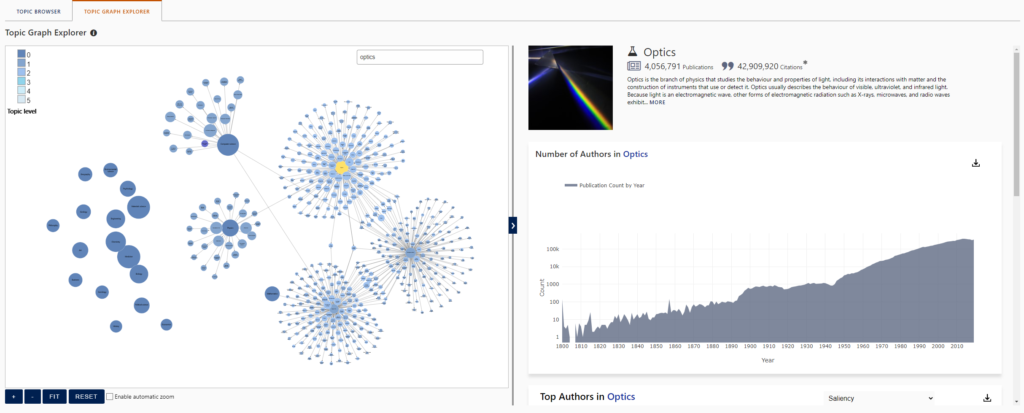
We feel that a visual representation of our topic hierarchy can give our users better context. Given that topics in Microsoft Academic can have many parents and children, seeing these relationships in a directed graph brings perspective to their structure. It also brings a bit of fun to exploring the topic graph as well. In its default state, the topic graph explorer shows all the top-level topics and allows you to expand down the graph. Nodes are color coded to the level of the hierarchy in which they appear and sized based on the number of publications contained in them.
As you navigate around the graph, child and parent nodes are drawn and connected. Depending on which entity analytics page you are viewing, information about entities within that topic will be shown. Below is a zoomed-out view of the Optics topic and its relationships on the author analytics page. On the left, you can see its parent relationship with Physics and its shared child topics with both Computer Vision and Algorithm. On the right, you can see detailed information the topic and the authors within.
When expanding nodes you can see their relationships and detailed information.
The topic graph explorer control also allows you to quickly find the topic you are interested in through the search feature. The search feature not only searches through all the topics in MAG, but also shows you matches to topics that exist in the visual graph you have created. Once a topic is selected, it is added to the visual graph where you can explorer related topics by expanding nodes up and down the hierarchy.
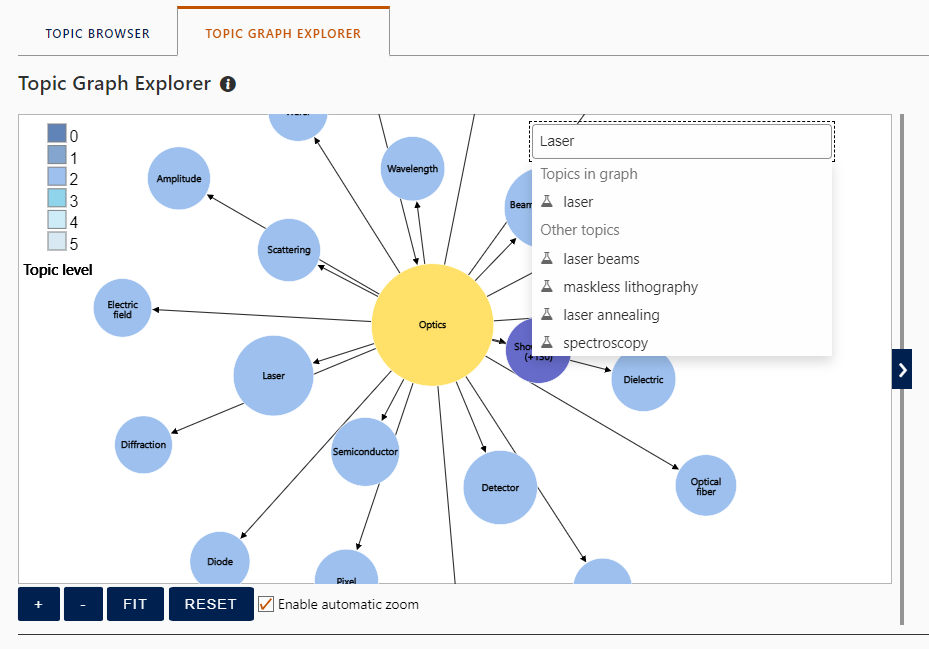
Search for topics in either the visual graph or all of MA
There are two ways to engage with this new feature. By navigating to any of the entity analytics pages you can then select the “Topic Graph Explorer” tab. The entity analytics pages can be access by click on an entity type in the entity statics bar on the home page.
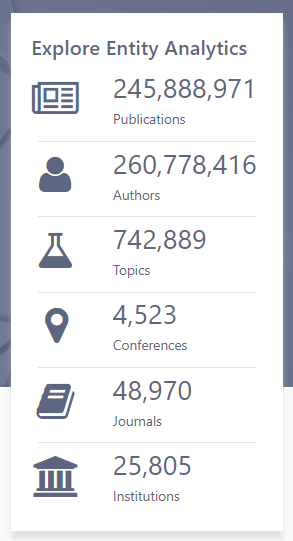
Click on entity statistics to see analytics
Or, if you are viewing a topic from it’s details page, you can click on the ‘Explore’ button and see entity analytics based on that topic.
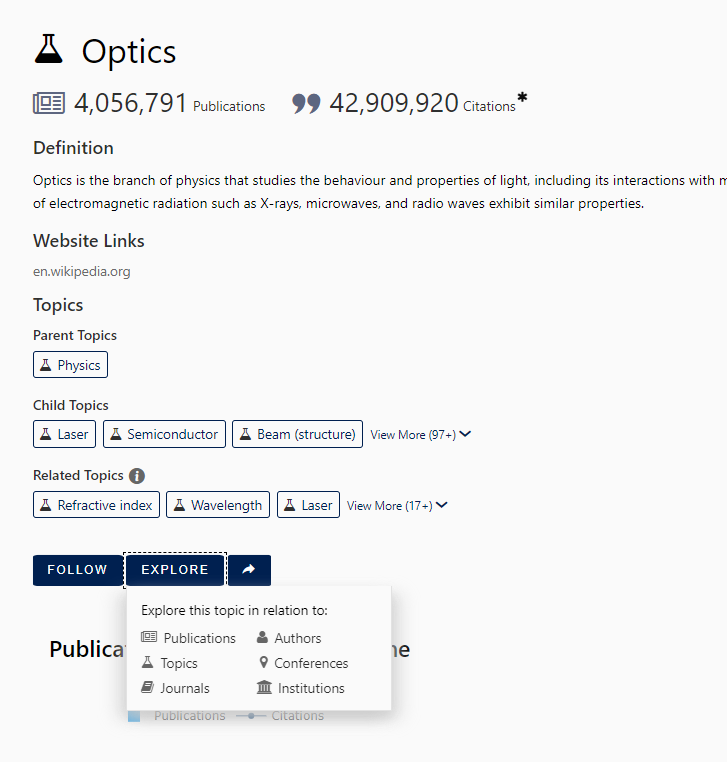
Explore a topic from its details page
We believe this feature brings a new perspective to our topic graph while adding a bit of fun as well. As always, if you have feedback on this feature or any other feature on the Microsoft Academic website, please reach out through the feedback control on the lower right on our website.