Introducing Aurora: The first large-scale foundation model of the atmosphere

Published

By , Senior Researcher , Senior Researcher , Researcher , Visiting Researcher , Principal Research Manager

satellite image of Storm Ciarán

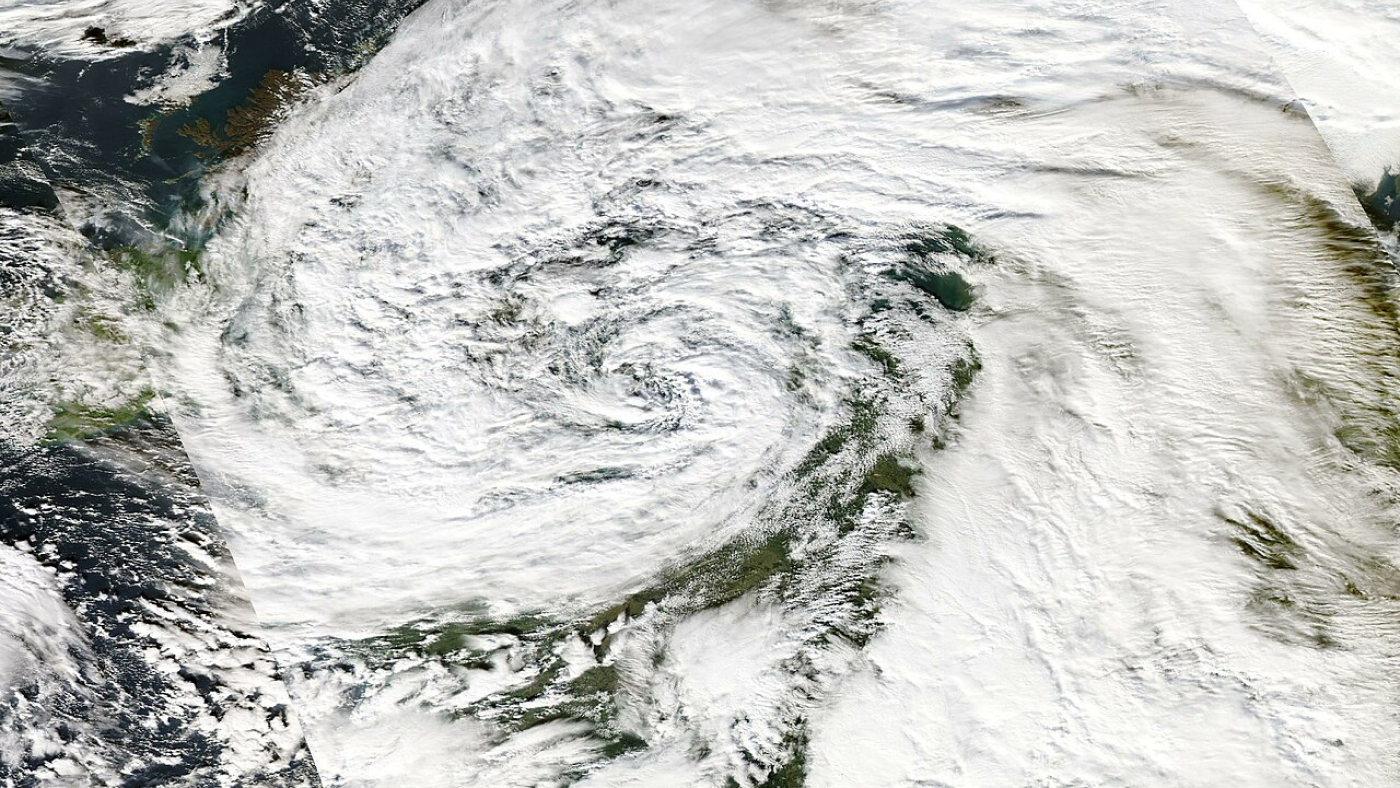
When Storm Ciarán battered northwestern Europe in November 2023, it left a trail of destruction. The low-pressure system associated with Storm Ciarán set new records for England, marking it as an exceptionally rare meteorological event. The storm’s intensity caught many off guard, exposing the limitations of current weather-prediction models and highlighting the need for more accurate forecasting in the face of climate change. As communities grappled with the aftermath, the urgent question arose: How can we better anticipate and prepare for such extreme weather events? 

A recent study by Charlton-Perez et al. (2024) underscored the challenges faced by even the most advanced AI weather-prediction models in capturing the rapid intensification and peak wind speeds of Storm Ciarán. To help address those challenges, a team of Microsoft researchers developed Aurora, a cutting-edge AI foundation model that can extract valuable insights from vast amounts of atmospheric data. Aurora presents a new approach to weather forecasting that could transform our ability to predict and mitigate the impacts of extreme events—including being able to anticipate the dramatic escalation of an event like Storm Ciarán.  

A flexible 3D foundation model of the atmosphere

Aurora is a 1.3 billion parameter foundation model for high-resolution  forecasting of weather and atmospheric processes. Aurora is a flexible 3D Swin Transformer with 3D Perceiver-based encoders and decoders. At pretraining time, Aurora is optimised to minimise a loss on multiple heterogeneous datasets with different resolutions, variables, and pressure levels. The model is then fine-tuned in two stages: (1) short-lead time fine-tuning of the pretrained weights (2) long-lead time (rollout) fine-tuning using Low Rank Adaptation (LoRA). The fine-tuned models are then deployed to tackle a diverse collection of operational forecasting scenarios at different resolutions.
Figure 1: Aurora is a 1.3 billion parameter foundation model for high-resolution forecasting of weather and atmospheric processes. Aurora is a flexible 3D Swin Transformer with 3D Perceiver-based encoders and decoders. At pretraining time, Aurora is optimized to minimize a loss on multiple heterogeneous datasets with different resolutions, variables, and pressure levels. The model is then fine-tuned in two stages: (1) short-lead time fine-tuning of the pretrained weights and (2) long-lead time (rollout) fine-tuning using Low Rank Adaptation (LoRA). The fine-tuned models are then deployed to tackle a diverse collection of operational forecasting scenarios at different resolutions.

Aurora’s effectiveness lies in its training on more than a million hours of diverse weather and climate simulations, which enables it to develop a comprehensive understanding of atmospheric dynamics. This allows the model to excel at a wide range of prediction tasks, even in data-sparse regions or extreme weather scenarios. By operating at a high spatial resolution of 0.1° (roughly 11 km at the equator), Aurora captures intricate details of atmospheric processes, providing more accurate operational forecasts than ever before—and at a fraction of the computational cost of traditional numerical weather-prediction systems. We estimate that the computational speed-up that Aurora can bring over the state-of-the-art numerical forecasting system Integrated Forecasting System (IFS) is ~5,000x. 

Spotlight: Microsoft research newsletter

Microsoft Research Newsletter

Stay connected to the research community at Microsoft.

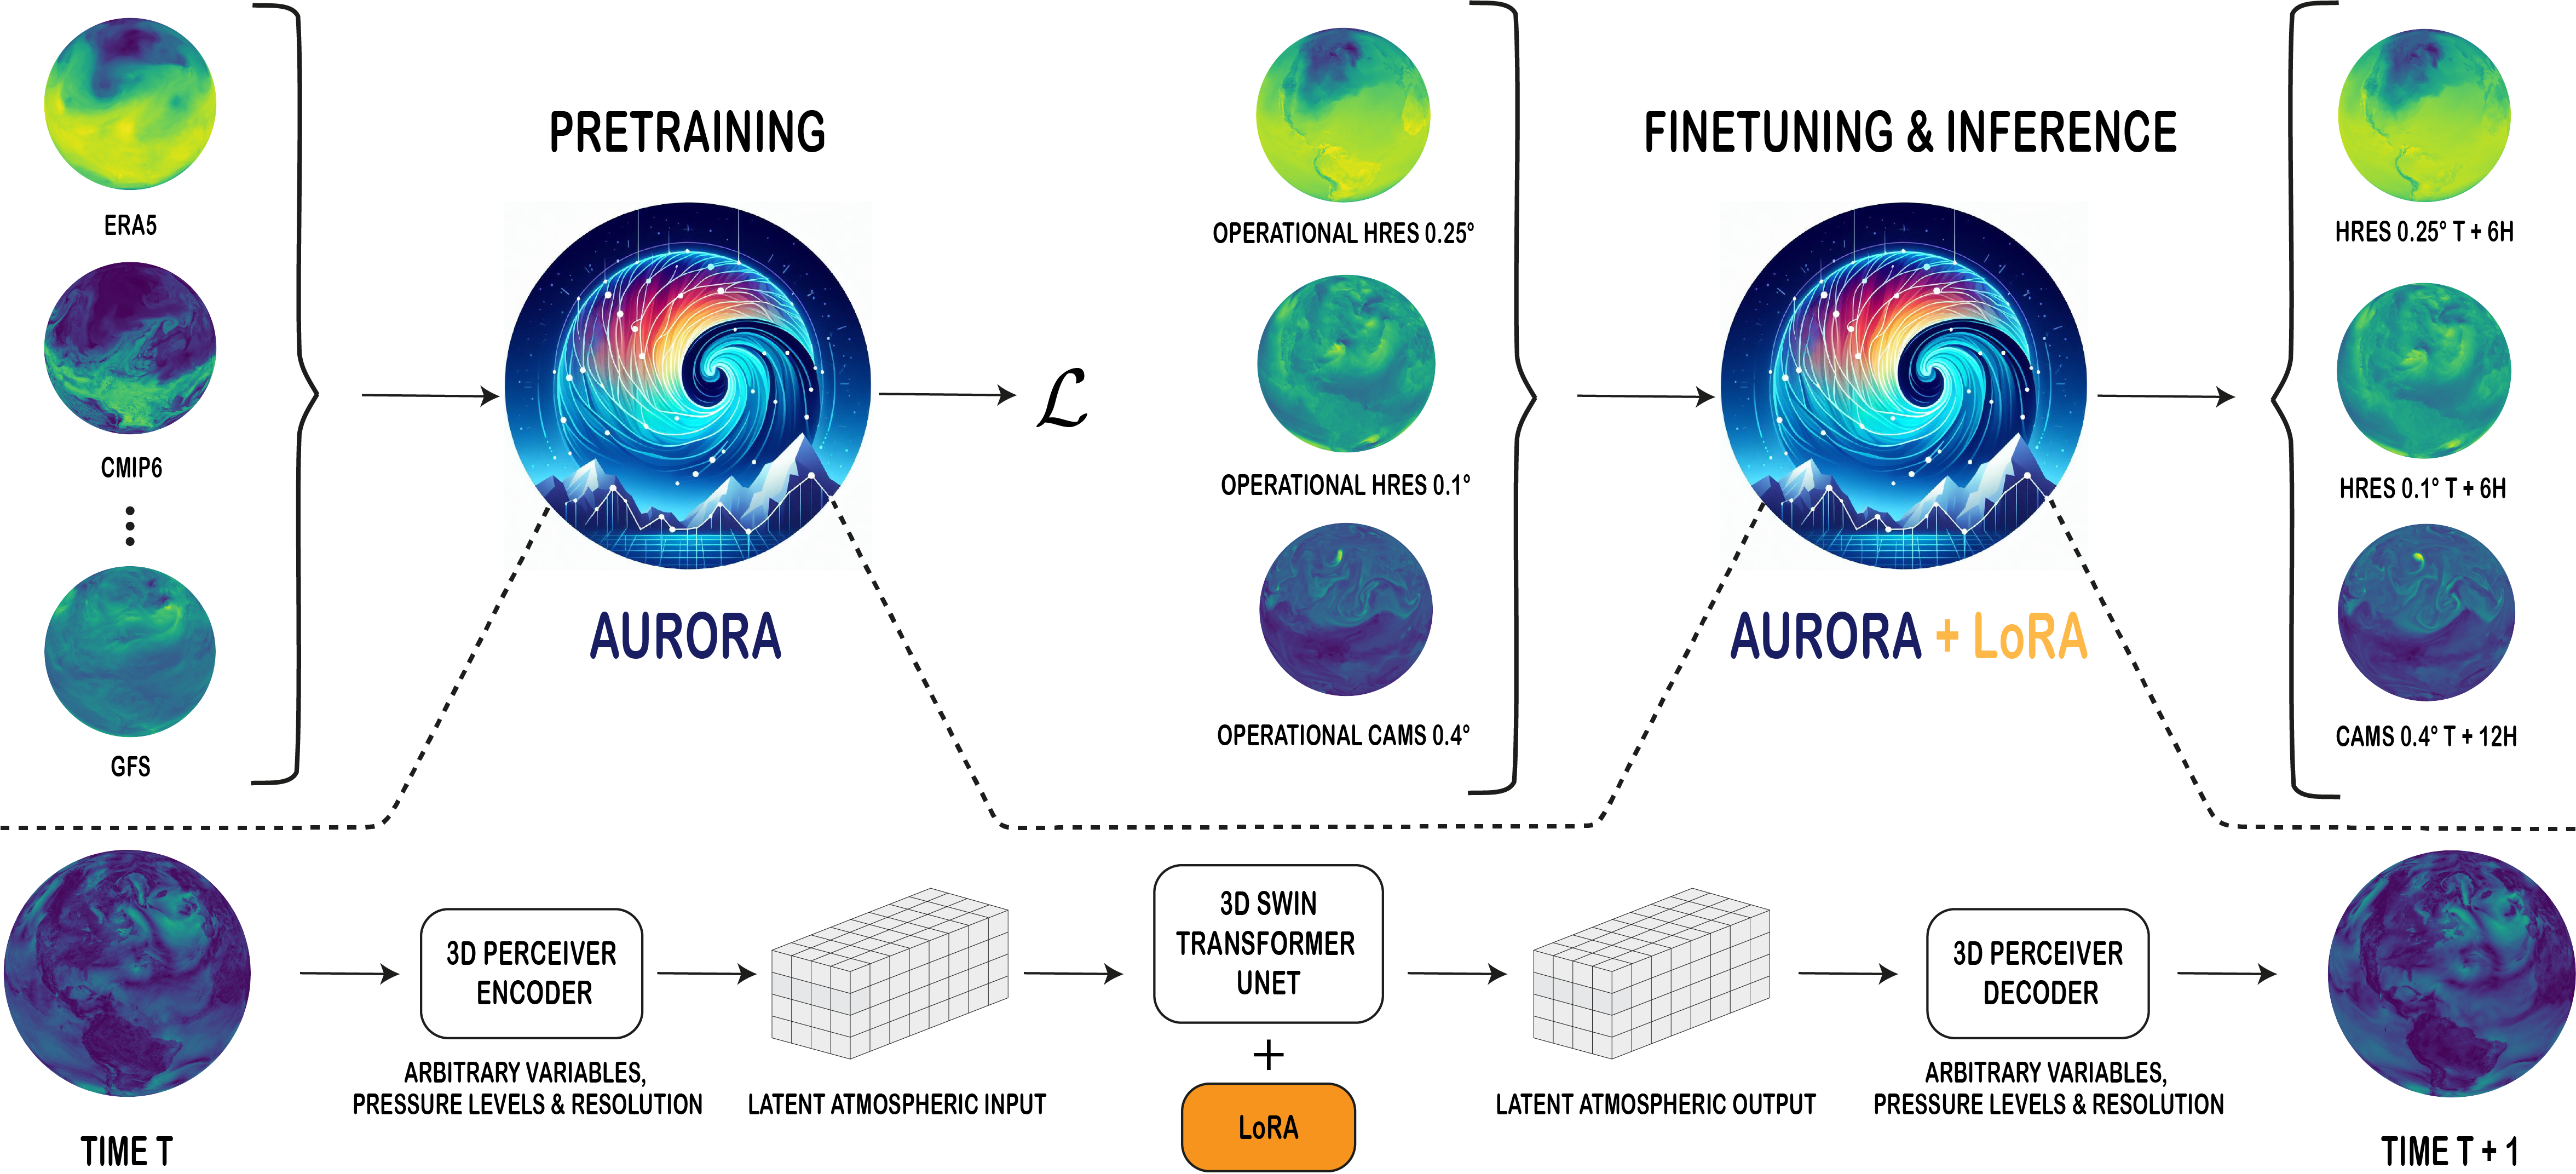
Beyond its impressive accuracy and efficiency, Aurora stands out for its versatility. The model can forecast a broad range of atmospheric variables, from temperature and wind speed to air-pollution levels and concentrations of greenhouse gases. Aurora’s architecture is designed to handle heterogeneous gold standard inputs and generate predictions at different resolutions and levels of fidelity. The model consists of a flexible 3D Swin Transformer with Perceiver-based encoders and decoders, enabling it to process and predict a range of atmospheric variables across space and pressure levels. By pretraining on a vast corpus of diverse data and fine-tuning on specific tasks, Aurora learns to capture intricate patterns and structures in the atmosphere, allowing it to excel even with limited training data when it is being fine-tuned for a specific task. 

Fast prediction of atmospheric chemistry and air pollution

Sample predictions for total column nitrogen dioxide by Aurora compared to CAMS analysis. Aurora was initialised with CAMS analysis at 1 Sep 2022 00 UTC. Predicting atmospheric gasses correctly is extremely challenging due to their spatially heterogeneous nature. In particular, nitrogen dioxide, like most variables in CAMS, is skewed towards high values in areas with large anthropogenic emissions such as densely populated areas in East Asia. In addition, it exhibits a strong diurnal cycle; e.g., sunlight reduces background levels through a process called photolysis. Aurora accurately captures both the extremes and background levels.
Latitude-weighted root mean square error (RMSE) of Aurora relative to CAMS, where negative values (blue) mean that Aurora is better. The RMSEs are computed over the period Jun 2022 to Nov 2022 inclusive. Aurora matches or outperforms CAMS on 74% of the targets.
Figure 2: Aurora outperforms operational CAMS across many targets. (a) Sample predictions for total column nitrogen dioxide by Aurora compared to CAMS analysis. Aurora was initialized with CAMS analysis at 1 Sep 2022 00 UTC. Predicting atmospheric gases correctly is extremely challenging due to their spatially heterogeneous nature. In particular, nitrogen dioxide, like most variables in CAMS, is skewed toward high values in areas with large anthropogenic emissions, such as densely populated areas in East Asia. In addition, it exhibits a strong diurnal cycle; e.g., sunlight reduces background levels via a process called photolysis. Aurora accurately captures both the extremes and background levels. (b) Latitude-weighted root mean square error (RMSE) of Aurora relative to CAMS, where negative values (blue) mean that Aurora is better. The RMSEs are computed over the period Jun 2022 to Nov 2022 inclusive. Aurora matches or outperforms CAMS on 74% of the targets.

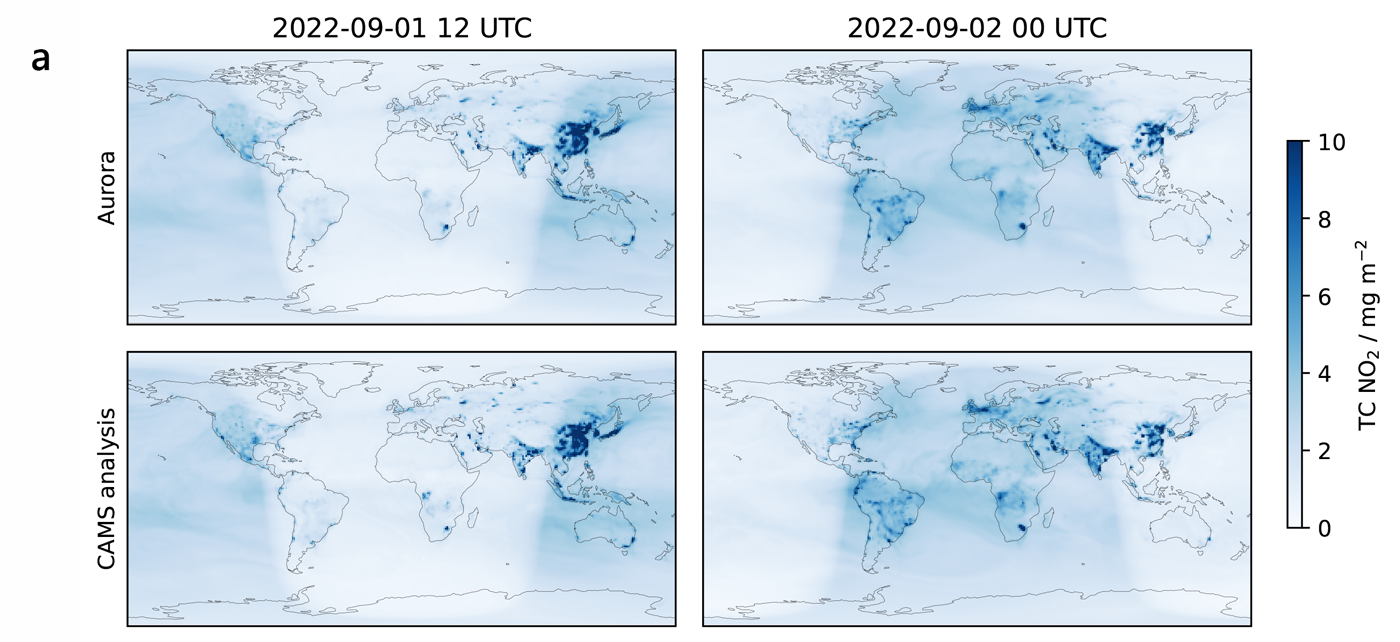
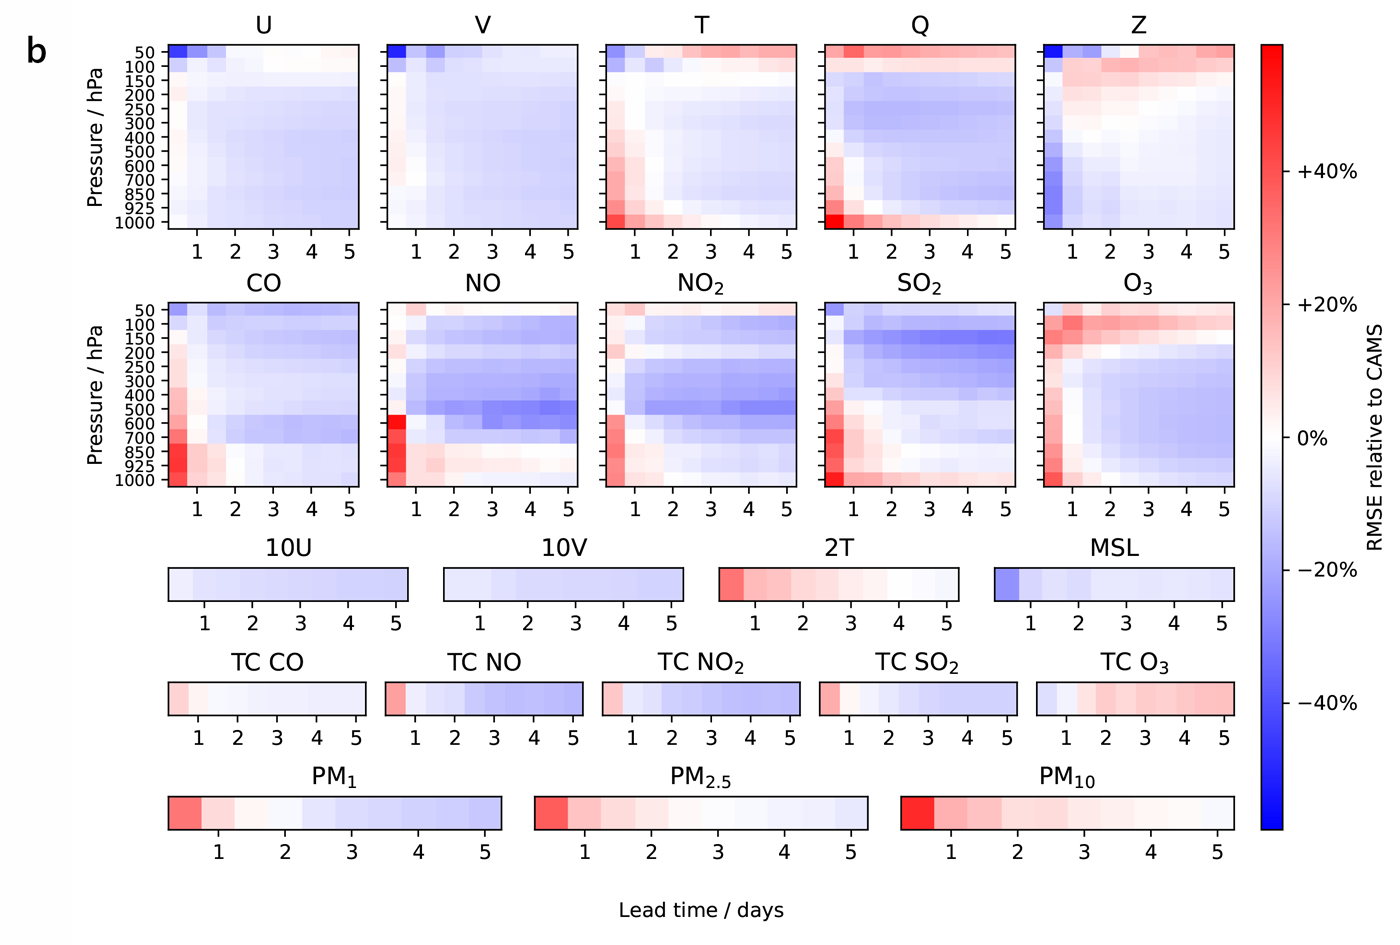
A prime example of Aurora’s versatility is its ability to forecast air-pollution levels using data from the Copernicus Atmosphere Monitoring Service (CAMS), a notoriously difficult task due to the complex interplay of atmospheric chemistry, weather patterns, and human activities, as well as the highly heterogeneous nature of CAMS data. By leveraging its flexible encoder-decoder architecture and attention mechanisms, Aurora effectively processes and learns from this challenging data, capturing the unique characteristics of air pollutants and their relationships with meteorological variables. This enables Aurora to produce accurate five-day global air-pollution forecasts at 0.4° spatial resolution, outperforming state-of-the-art atmospheric chemistry simulations on 74% of all targets, demonstrating its remarkable adaptability and potential to tackle a wide range of environmental prediction problems, even in data-sparse or highly complex scenarios. 

Data diversity and model scaling improve atmospheric forecasting

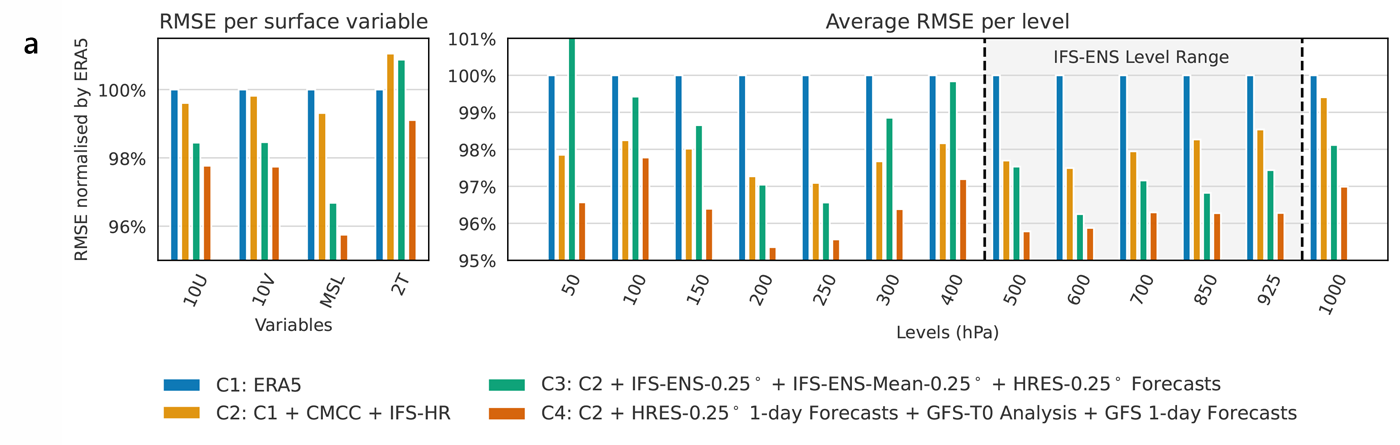
One of the key findings of this study is that pretraining on diverse datasets significantly improves Aurora’s performance compared to training on a single dataset. By incorporating data from climate simulations, reanalysis products, and operational forecasts, Aurora learns a more robust and generalizable representation of atmospheric dynamics. It is thanks to its scale and diverse pretraining data corpus that Aurora is able outperform state-of-the-art numerical weather-prediction models and specialized deep-learning approaches across a wide range of tasks and resolutions. 

Performance versus ERA5 2021 at 6h lead time for models pretrained on different dataset configurations (i.e., no fine-tuning) labeled by C1-C4. The root mean square errors (RMSEs) are normalised by the performance of the ERA5-pretrained model (C1). Adding low-fidelity simulation data from CMIP6 (i.e., CMCC and IFS-HR) improves performance almost uniformly (C2). Adding even more simulation data improves performance further on most surface variables and for the atmospheric levels present in this newly added data (C3). Finally, configuration C4, which contains a good coverage of the entire atmosphere and also contains analysis data from GFS achieves the best overall performance with improvements across the board.
Pretraining on many diverse data sources improves the forecasting of extreme values at 6h lead time across all surface variables of IFS-HRES 2022. Additionally, the results also hold on wind speed, which is a nonlinear function of 10U and 10V.
Bigger models obtain lower validation loss for the same amount of GPU hours. We fit a power law that indicates a 5% reduction in the validation loss for every doubling of the model size.
Figure 3: Pretraining on diverse data and increasing model size improves performance. (a) Performance versus ERA5 2021 at 6h lead time for models pretrained on different dataset configurations (i.e., no fine-tuning) labeled by C1-C4. The root mean square errors (RMSEs) are normalized by the performance of the ERA5-pretrained model (C1). Adding low-fidelity simulation data from CMIP6 (i.e., CMCC and IFS-HR) improves performance almost uniformly (C2). Adding even more simulation data improves performance further on most surface variables and for the atmospheric levels present in this newly added data (C3). Finally, configuration C4, which contains good coverage of the entire atmosphere and also contains analysis data from GFS achieves the best overall performance with improvements across the board. (b) Pretraining on many diverse data sources improves the forecasting of extreme values at 6h lead time across all surface variables of IFS-HRES 2022. Additionally, the results also hold on wind speed, which is a nonlinear function of 10U and 10V. (c) Bigger models obtain lower validation loss for the same amount of GPU hours. We fit a power law that roughly translates into a 5 reduction in the training loss for every doubling of the model size.

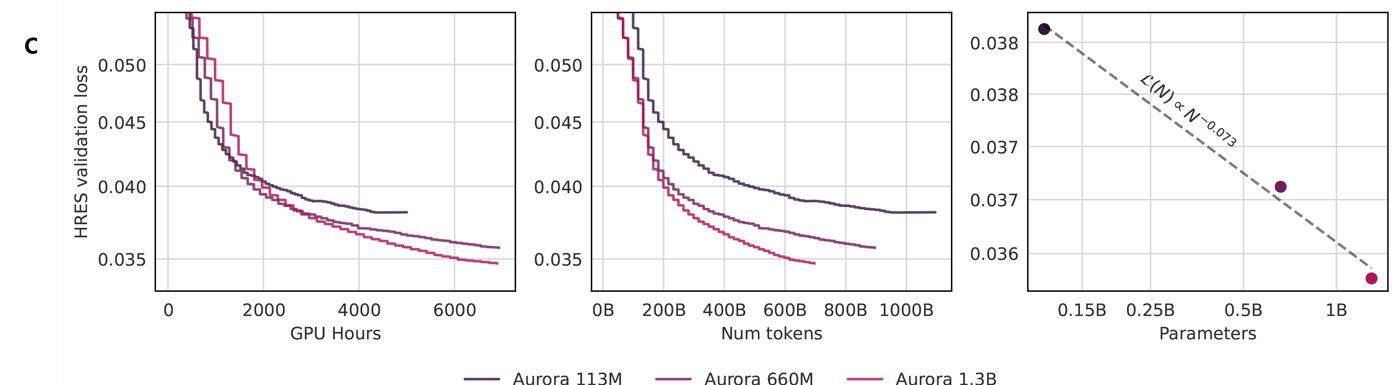
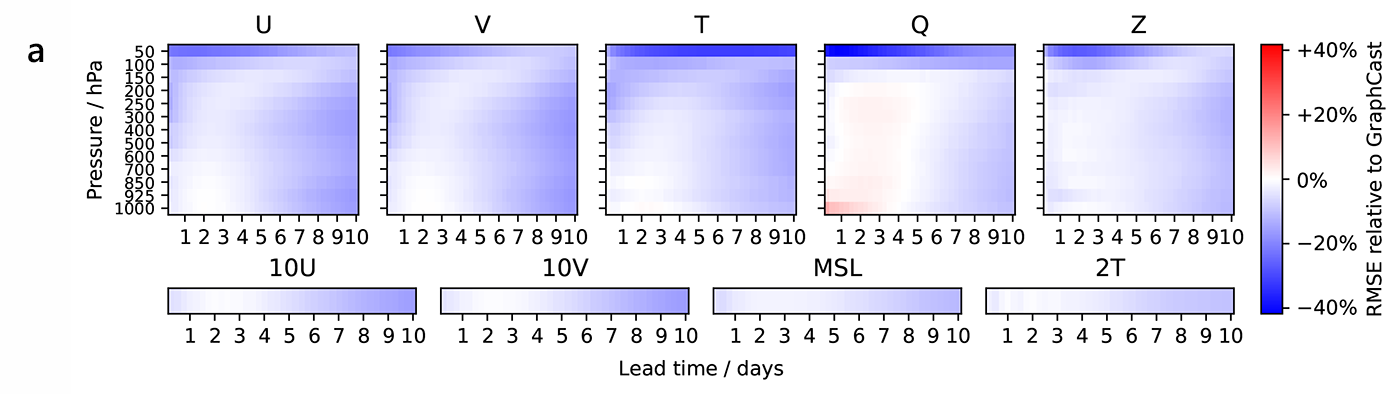
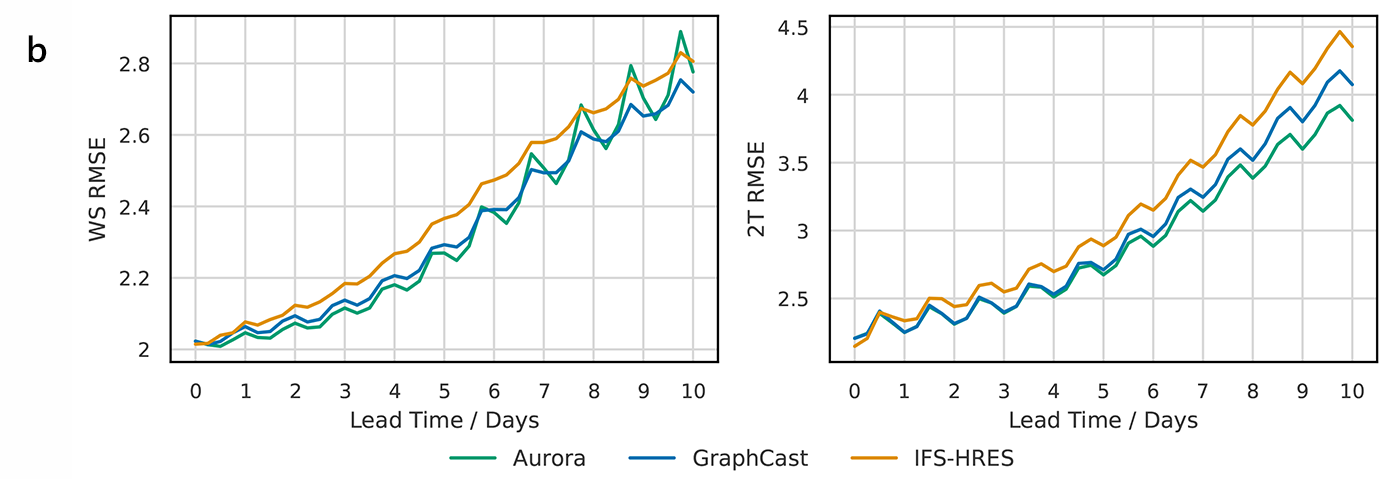
A direct consequence of Aurora’s scale, both in terms of architecture design and training data corpus, as well as its pretraining and fine-tuning protocols, is its superior performance over the best specialized deep learning models. As an additional validation of the benefits of fine-tuning a large model pretrained on many datasets, we compare Aurora against GraphCast — pretrained only on ERA5 and currently considered the most skillful AI model at 0.25-degree resolution and lead times up to five days. Additionally, we include IFS HRES in this comparison, the gold standard in numerical weather prediction. We show that Aurora outperforms both when measured against analysis, weather station observations, and extreme values. 

Scorecard versus GraphCast at 0.25-degrees resolution. Aurora matches or outperforms GraphCast on 94% of targets. Aurora obtains the biggest gains (40%) over GraphCast in the upper atmosphere, where GraphCast performance is known to be poor. Large improvements up to 10-15% are observed at short and long lead times. The two models are closest to each other in the lower atmosphere at the 2--3 day lead time, which corresponds to the lead time GraphCast was rollout-finetuned on. At the same time, GraphCast shows slightly better performance up to five days and at most levels on specific humidity (Q).
Root mean square error (RMSE) for Aurora, GraphCast, and IFS-HRES as measured by global weather stations during 2022 for wind speed and surface temperature.
Thresholded RMSE for Aurora, GraphCast and IFS-HRES normalized by IFS-HRES performance. Aurora demonstrates improved prediction for the extreme values, or tails, of the surface variable distributions. In each plot values to the right of the centre line are cumulative RMSEs for targets found to sit above the threshold, and those to the left represent target values sitting below the threshold.
Figure 4: Aurora outperforms operational GraphCast across the vast majority of targets. (a) Scorecard versus GraphCast at 0.25-degrees resolution. Aurora matches or outperforms GraphCast on 94% of targets. Aurora obtains the biggest gains (40%) over GraphCast in the upper atmosphere, where GraphCast performance is known to be poor. Large improvements up to 10%-15% are observed at short and long lead times. The two models are closest to each other in the lower atmosphere at the 2-3 day lead time, which corresponds to the lead time GraphCast was rollout-finetuned on. At the same time, GraphCast shows slightly better performance up to five days and at most levels on specific humidity (Q). (b) Root mean square error (RMSE) and mean absolute error (MAE) for Aurora, GraphCast, and IFS-HRES as measured by global weather stations during 2022 for wind speed (left two panels) and surface temperature (right two panels). (c) Thresholded RMSE for Aurora, GraphCast and IFS-HRES normalized by IFS-HRES performance. Aurora demonstrates improved prediction for the extreme values, or tails, of the surface variable distributions. In each plot values to the right of the center line are cumulative RMSEs for targets found to sit above the threshold, and those to the left represent target values sitting below the threshold.

A paradigm shift in Earth system modeling 

The implications of Aurora extend far beyond atmospheric forecasting. By demonstrating the power of foundation models in the Earth sciences, this research paves the way for the development of comprehensive models that encompass the entire Earth system. The ability of foundation models to excel at downstream tasks with scarce data could democratize access to accurate weather and climate information in data-sparse regions, such as the developing world and polar regions. This could have far-reaching impacts on sectors like agriculture, transportation, energy harvesting, and disaster preparedness, enabling communities to better adapt to the challenges posed by climate change. 

As the field of AI-based environmental prediction evolves, we hope Aurora will serve as a blueprint for future research and development. The study highlights the importance of diverse pretraining data, model scaling, and flexible architectures in building powerful foundation models for the Earth sciences. With continued advancements in computational resources and data availability, we can envision a future where foundation models like Aurora become the backbone of operational weather and climate prediction systems, providing timely, accurate, and actionable insights to decision-makers and the public worldwide. 

Acknowledgements

We are grateful for the contributions of Cristian Bodnar, a core contributor to this project.

Related publications

Continue reading

See all blog posts