 Research
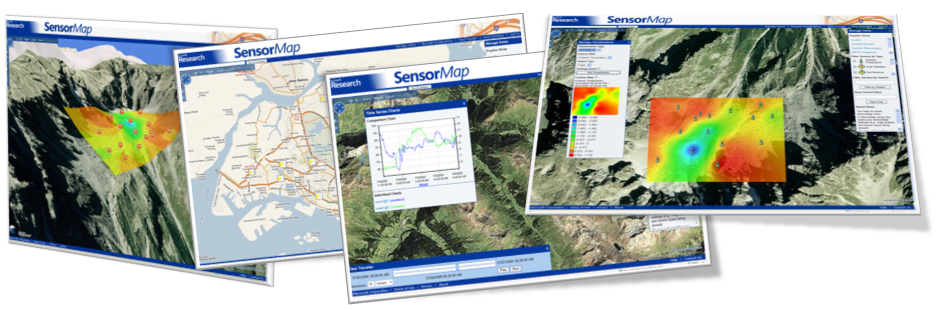
SenseWeb is a peer produced sensor network that consists of sensors deployed by contributors across the globe. It allows developing sensing applications that use the shared sensing resources and our sensor querying and tasking mechanisms. SensorMap is one such application that mashes up sensor data from SenseWeb on a map interface, and provides interactive tools to selectively query sensors and visualize data, along with authenticated access to manage sensors.

Description: This video demonstrates how SensorMap simplifies the temporal and spatial exploration of sensory data, using the Genepi deployment site of the Swiss Experiment (opens in new tab) project as a concrete example. First, SensorMap allows users to access the most recent readings of a weather station by a popup panel. Second, SensorMap enables exploration of historic data via time series charts. A comparison chart visualizes data for multiple sensors in one chart for direct comparison and correlation. Third, SensorMap can create contour maps for any selected sensor types in view, visualizing the spatial distribution of the sensory data. A time traveler panel allows users to go to any time point and see the spatial distribution of a particular time point. Fourth, SensorMap supports replay of contour maps over time to investigate the evolvement of an interested environmental metric over time and space. Finally, 3D support of Virtual earth allows users to see the sensor layout as well as the contour maps over 3D terrain, clearly presenting the interactions among them.
 (opens in new tab)
 (opens in new tab)
Partner Research Manager