
A large body of human-computer interaction research has focused on developing metaphors and tools that allow people to effectively issue commands and directly manipulate informational objects. However, with the advancement of computational techniques such as machine learning, we now have the unprecedented ability to embed ‘smarts’ that allow machines to assist and empower people in completing their tasks. We believe that there exists a computational design methodology which allows us to gracefully combine automated services with direct user manipulation. We explore ways to help people easily build machine learning models by leveraging information visualization. We aim to effectively support understanding and debugging of machine learning models.
Squares
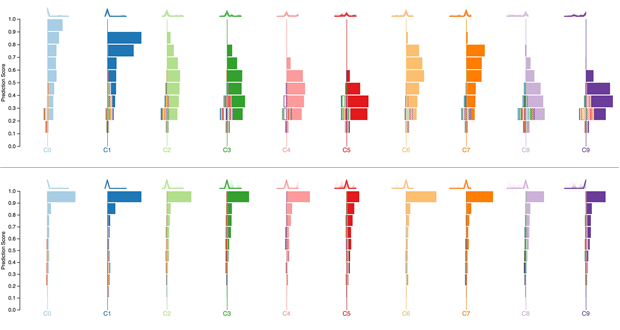
Squares is a performance visualization for multiclass classification problems. Squares supports estimating common performance metrics while displaying instance-level distribution information necessary for helping practitioners prioritize efforts and access data. Our controlled study shows that practitioners can assess performance significantly faster and more accurately with Squares than a confusion matrix, a common performance analysis tool in machine learning.
ModelTracker
![]()
ModelTracker is an interactive visualization that subsumes information contained in numerous traditional summary statistics and graphs while displaying example-level performance and enabling direct error examination and debugging. Usage analysis from machine learning practitioners building real models with ModelTracker over six months shows ModelTracker is used often and throughout model building. A controlled experiment focusing on ModelTracker’s debugging capabilities shows participants prefer ModelTracker over traditional tools without a loss in model performance.
FeatureInsight
 Machine learning requires an effective combination of data, features, and algorithms. While many tools exist for working with machine learning data and algorithms, support for thinking of new features, or feature ideation, remains poor. We investigated two general approaches to helping machine learning practitioners think of new features: visual summaries and sets of errors. FeatureInsight is an interactive visual analytics tool for building new dictionary features (semantically related groups of words) for text classification problems. It supports an error-driven feature ideation process and provides interactive visual summaries of sets of misclassified documents. Our study results show that visual summaries significantly improve feature ideation, especially in combination with sets of errors. People also preferred visual summaries over viewing raw data, and only preferred examining sets when visual summaries were provided.
CueT
 Network alarm triage refers to grouping and prioritizing a stream of low-level device health information to help operators find and fix problems. Today, this process tends to be largely manual because existing tools cannot easily evolve with the network. CueT uses interactive machine learning to learn from the triaging decisions of operators. It then uses that learning in novel visualizations to help them quickly and accurately triage alarms. Unlike prior interactive machine learning systems, CueT handles a highly dynamic environment where the groups of interest are not known a-priori and evolve constantly. A user study with real operators and data from a large network shows that CueT significantly improves the speed and accuracy of alarm triage compared to the network’s current practice.
NetClinic

Diagnosing faults in an operational computer network is a frustrating, time-consuming exercise. Despite advances, automatic diagnostic
tools are far from perfect: they occasionally miss the true culprit and are mostly only good at narrowing down the search to a few potential culprits. This uncertainty and the inability to extract useful sense from tool output renders most tools not usable to administrators. To bridge this gap, NetClinic couples interactive visualization with an automated diagnostic tool for enterprise networks. It enables administrators to verify the output of the automatic analysis at different levels of detail and to move seamlessly across levels while retaining appropriate context. A qualitative user study shows that NetClinic users can accurately identify the culprit, even when it is not present in the suggestions made by the automated component. We also find that supporting a variety of sensemaking strategies is a key to the success of systems that enhance automated diagnosis.
ManiMatrix
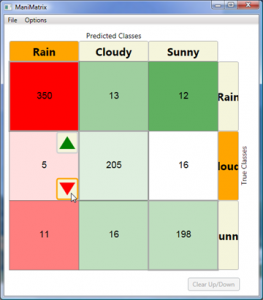
Interest has been growing within HCI on the use of machine learning and reasoning in applications to classify such hidden states as user intentions, based on observations. HCI researchers with these interests typically have little expertise in machine learning and often employ toolkits as relatively fixed “black boxes” for generating statistical classifiers. However, attempts to tailor the performance of classifiers to specific application requirements may require a more sophisticated understanding and custom-tailoring of methods. ManiMatrix provides controls and visualizations that enable system builders to refine the behavior of classification systems in an intuitive manner. With ManiMatrix, people directly refine parameters of a confusion matrix via an interactive cycle of reclassification and visualization. We evaluated the effectiveness of the approach in a user study. Results show that participants are able to quickly and effectively modify decision boundaries of classifiers to tailor the behavior of classifiers to problems at hand.
EnsembleMatrix
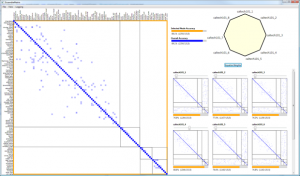 In ensemble learning, algorithms combine multiple classifiers to build one that is superior to its components. EnsembleMatrix is an interactive visualization system that presents a graphical view of confusion matrices to help people understand relative merits of various classifiers. EnsembleMatrix allows people to directly interact with the visualizations in order to explore and build combination models. We evaluate the efficacy of the system and the approach in a user study. Results show that participants are able to quickly combine multiple classifiers operating on multiple feature sets to produce an ensemble classifier with accuracy that approaches best-reported performance classifying images in the CalTech-101 dataset.
People
Saleema Amershi
Partner Research Manager