 Microsoft manages hundreds of buildings around the world with various purposes—warehouses, offices, labs, cafes, and so on. Like all companies with large real estate footprints, the company wanted to find better ways of managing each building type. To do that, a team in Microsoft Digital set out to transform the way it categorizes its real estate data.
Microsoft’s corporate real estate team has 20 different sources of data from 10 different supplier systems. The team could grab all kinds of numbers covering everything from parking garages to labs to antennas, but much of it was stuck in spreadsheets or different silos, and it was labor-intensive and time-consuming to pull the right information together to get a consistent big-picture view.
The plan was to make that data easy for the company to access, analyze, and act on.
“Although we had a lot of data, it was in pockets and our real estate team couldn’t get solid or consistent analytics out of it,” says Becky West, principal group program manager for the Digital Workplace team within Microsoft Digital, the organization that powers, protects, and transforms Microsoft. “Our goal was to bring together this vast amount of data into a single repository so that the data could be combined, and more importantly, easily used by the real estate team for their day-to-day decision making.”
[Watch to learn how Microsoft is improving building management with Microsoft Azure Digital Twins. Learn more about how Microsoft created its digital workplace. Read how Microsoft uses machine learning to develop smart energy solutions.]
Building a new view
Managing real estate at Microsoft isn’t just real estate in the traditional sense. It also includes transportation, dining, building access, and facility operations. And it’s spread across the world, to more than 100 different countries and regions—each with its own systems and local regulations.
We wanted to bring a common interpretation, an apples-to-apples comparison view so that everybody was looking at the same source of truth rather than their own version of it.
—Harris Thamby, senior program manager for data and insights, Microsoft Digital
The Microsoft real estate team already had some notable achievements under its belt. It built a virtual lobby portal for fast visitor check-in and a reservation app for employee shuttle and bus reservations. It created a system to order ahead from the company’s campus cafeterias. It made a Microsoft Dynamics 365 tool to manage all aspects of global facilities management.
Building an enormous real estate data repository that could be used across departments to make company-wide decisions was the next step.
“We wanted to bring a common interpretation, an apples-to-apples comparison view so that everybody was looking at the same source of truth rather than their own version of it,” says Harris Thamby, a senior program manager for data and insights on the Digital Workplace team.
Starting from scratch
In the past, when an executive asked for a view of some dimension of data, such as financial outlays for a category on campus, a group of people would piece together items from different data sources into another data source for a presentation. It would sometimes take weeks, and even then, the numbers might not be current or were based on someone’s specific interpretation.
The team looked at usage scenarios and held workshops to figure out what reports were scattered across the real estate department and what reports people wished they had. They talked to transportation managers about the information needed to provide buses for employees and maintain fleets. They talked to real estate portfolio managers about headcounts, cost outlays, and lease payments and expirations.
They were looking for a way to standardize all that data so it was always current, always accurate, and always actionable.
They sorted the information into three groups based on priority. Group A was the must-have, the core set of information the company couldn’t do without. Groups B and C were the nice-to-have, the wish list. They would eventually get through all of A and most of B.
“Building our first one to two years was just like a data monster,” Thamby says. “We just needed to absorb data.” Much of this data consolidation happened when converging multiple legacy systems into the Enterprise Data Lake (EDL), but more on that later. There was still a lot to do to build the needed applied analytics solution.
The financial benefits were also becoming more apparent, especially because Microsoft’s real estate holdings were among its most expensive assets.
“We have X number of employees assigned to certain buildings, but who actually goes into that office?” asks Patrick McDonald, who runs the technology portfolio for the Microsoft Global Workplace Services team. “If we are overbuilding or overmanaging our real estate portfolio by 20 percent, that’s a significant amount of money to Microsoft if we can offload some of that.”
Cleaning and organizing the data
The next step for the team was cleaning the data. That meant taking a step back, looking at the way everything was sorted, and creating rules for categorizing the data going forward.
They noticed some strange anomalies. On the surface, it looked like some employees were working in bathrooms. There were negative numbers of people assigned to buildings, and people assigned to inactive buildings. Parking garages were marked as buildings. Antennas were marked in weird places.
“When you start bringing all this data together, you’re going to unearth all the issues with local data entry and global management,” West says. “In order to be successful, you have to be very accepting of that and figure out how to get it solved and not point fingers. If you go into a project like this, you have to accept that there’s going to be bad data. The emphasis should be on ‘how do you get good data moving forward.’”
Once the data was cleaned up, it was time to organize it in ways that would hold up while people started using it in real time. The team talked a lot about data hierarchies and structures. They set up taxonomies in smart ways.
“The idea running in at the back of our minds was that we are here to create experiences—a spectrum of positive and impactful experiences that can be correlated to employee productivity, motivation, and overall performance,” says Aparana Gupta, senior software engineering manager for the Digital Workplace team. It was important to take that huge pile of data and generate time-sensitive insights that could drive critical decisions about optimizing operations and cost, she adds.
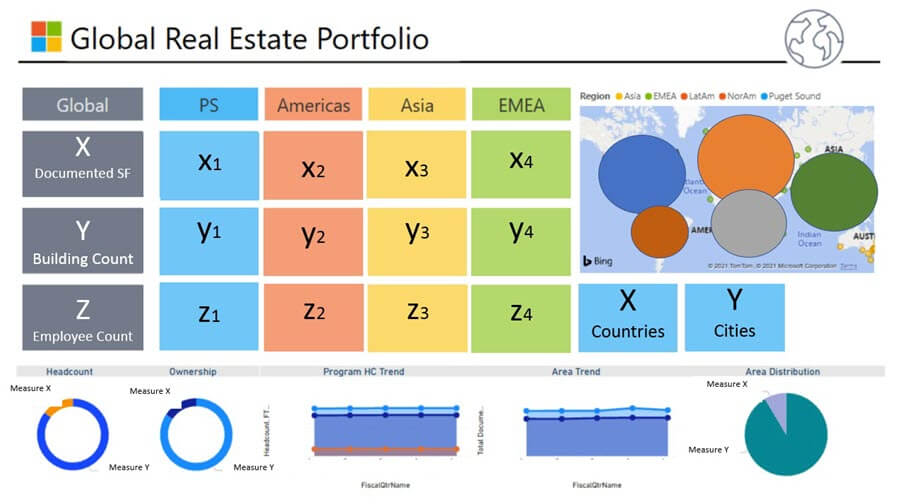
They created dashboards so that portfolio managers and facility operations managers had information at their fingertips for operations, planning, lease negotiations, and forecasting. On the transportation side, people could better plan ways to shuttle employees to work and what size vehicles to use.
“We had to keep in mind that this report should be simple enough to be read by anyone who is not technical,” says Sanchita Srivastava, a senior program manager on the team. Some users would need to pull granular numbers out while others needed aggregated information, so the challenge was figuring out the best way to serve both audiences.
The team built a new system in Azure on top of the Enterprise Data Lake (EDL), says Naval Tripathi, a principal software engineering manager on the Microsoft Digital Employee Experience team.
“EDL is a shared data lake foundation built and managed by the Enterprise Data Team in Microsoft Digital, providing a suite of storage, governance, compliance and security capabilities to tenants,” Tripathi says. “EDL is a core foundation for our team and we are in the process of migrating our compute pipelines to Azure Synapse from Databricks to take advantage of new Azure compute and analytics capabilities directly on top of the EDL.”
We were so glad to have this in place once COVID hit. We already had a lot of data about how many people were coming into our spaces and what our capacity for the spaces was. We were able to pivot almost on a dime.
—Becky West, principal group program manager, Microsoft Digital
If a building lease was expiring and the team wanted to know how many employees work there, it became easy to pull up that information using Microsoft Azure.
About a year and a half into the process, the group started to see the real appeal of their work when other teams at Microsoft asked to add their data to the ecosystem. Those teams saw that it was more valuable to use the Microsoft Azure-based platform than to maintain their own separate databases.
A global pandemic changes the game
COVID-19 hit just as the real estate team was in the final stages of its data transformation. Suddenly, all the information that had been gathered, cleaned, and organized took on a new significance.
“We were so glad to have this in place once COVID hit,” West says. “We already had a lot of data about how many people were coming into our spaces and what was our capacity for the spaces. We were able to pivot almost on a dime.”
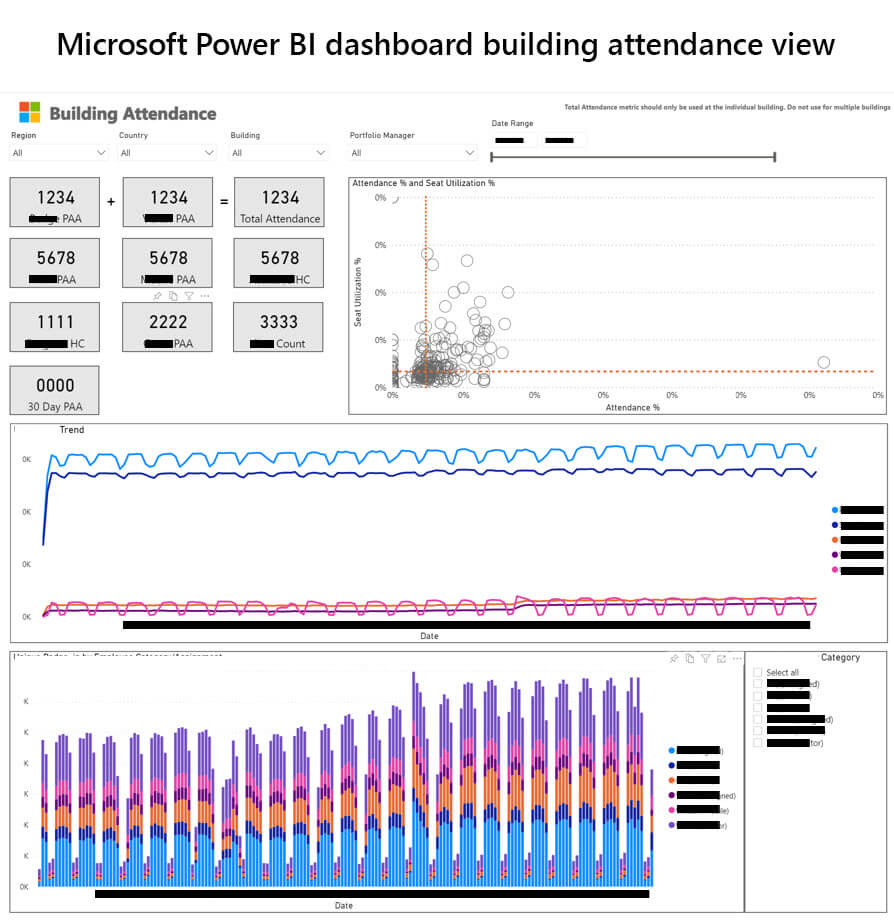
The team built Microsoft Power BI reports as safety guidelines changed. They were able to get a sense of capacity with six feet of socially distanced spacing between employees. Since Microsoft moved to hybrid workplace in 2022, occupancy data became even more important.
The team is putting dashboards together showing how many people go into campus buildings and how many times a week they go there, and merging occupancy data with behavioral signals from Viva Insights and ad-hoc observational studies. The insights helped Microsoft formulate hybrid design strategies and portfolio optimization decisions.
Microsoft is adding Internet of Things (IoT) sensors to its buildings to better understand building utilization. Eventually, some buildings will have more than 4,000 sensors each, relaying all kinds of information about how facilities are being used.
In the future, sensors will alert Microsoft’s facilities team to when a space needs cleaning. Sensors on restroom doors can show how often they need to be cleaned and at what time of day. Parking garages will relay more information about usage. Cafeterias can send alerts if they are at risk of getting too crowded—a particular concern in the age of COVID-19.
“It’s opening up opportunities that we probably never intended when we started some of these exercises,” Thamby says. “People are trying to take the data and see how to combine things and produce an inference out of it that we never would have intended.”
Next up is applying artificial intelligence and machine learning to the vast data library for better forecasting, prediction, and optimization. There are currently pilot solutions being tested for forecasting daily building occupancy to support decision making in space planning and support services like dining resource allocations. For example, predicting on-campus attendance on an extra-rainy day, or determining what size conference rooms work for engineers versus account managers. The technology doesn’t give information about specific employees, but rather how the collective in-person workforce is using campus facilities.
“The team is also making digital replicas of the company’s buildings using Microsoft Azure Digital Twins,” Tripathi says. “Data from those ‘digital twins’ combined with various other information in the data platform will help Microsoft comprehensively monitor the health of its buildings and overlay data on those models to help with facilities operations.”
The team is also working on building an operations dashboard action center (actionable BI) by combining the real time sensor feeds with latent data and providing insights and actions as they arrive.
“We are very intentional in our approach to eliminate the delays of human eyes to catch the issues and decide on an action,” Tripathi says.
It’s all about giving users information they need to improve the way they work.
“Information is power,” Thamby says. “It helps people make the right choices and make more data-driven decisions on here’s what we want to do, here’s what we don’t want to do, here’s what we want to focus on.”

- Watch to learn how Microsoft is improving building management with Microsoft Azure Digital Twins.
- Learn more about how Microsoft created its digital workplace.
- Read how Microsoft uses machine learning to develop smart energy solutions.

Tags: Microsoft Azure